Pages

Tuesday, May 31, 2011

Boundary spanning

Portfolio managers--and, for that matter, system engineers--should take a look at this paper published this spring in the MIT Sloan Management Review. Entitled "Flat World, Hard Boundaries: how to lead across them", the authors Christ Ernst and Donna Chrobat-Mason posit five boundaries [or barriers] to business success--easily mapped to project success--and six practices to span those boundaries.

 
What I like is the matrix they have developed that summaries the whole paper into a five by six digest of the barriers and practices. [When you read the article, click on the panel titled "practices vs boundaries" to open a picture of the matix].

In a word, without rewriting the article for the authors, what you'll see is:
  • Boundaries: Vertical, horizontal, stakeholder, geographic, and demographic
  • Practices: Buffering, reflecting, connecting, mobilizing, weaving, and transforming
What's not too exciting is some of the recommendations at the cross points of the matrix. For example, this one at the intersection of Reflecting x Vertical Boundaries: 'call a meeting senior managers to facilitate upward movement of ideas generated by employees'

That meeting may be hard to schedule!

There are some good ideas in this article, as given at Mobilizing vs Stakeholder Boundary: develop an appealing goal that will motivate competition with your market competitors

Give it a read.

 
Delicious
 Bookmark this on Delicious  
Are you on LinkedIn?    Share this article with your network by clicking on the link.

Monday, May 30, 2011

Memorial Day

Happy Memorial Day

The Arlington National Cemetery


Semper Fi!


Sunday, May 29, 2011

Project teams to project networks

MIT's business magazine, The Sloan Management Review, has some insights for expanding project teams in the Spring 2011 edition. In an article entitled "Why project networks beat teams", the authors assert that for a class of knowledge-intensive projects, a good practice is to extend the project team into a project network by case-by-case inclusion of core team member's own personal networks of subject matter experts.

The authors abstract makes these points:
 Typically, project networks consist of a core set of team members who bring in noncore contributors (such as other company employees, suppliers, consultants or customers) from their personal networks to provide knowledge, information or feedback regarding the team’s task. The project network thus takes advantage of both the project team as a whole and the personal networks of the members.

A project network can be helpful whenever any of the following conditions is present:
  • The project scope is beyond the control and sphere of influence of the core team;


  • The task is complex, and it is unclear whether or not there is an optimal solution; or


  • Some of the knowledge necessary to create a high-value outcome resides elsewhere.


  • Managers can use a project’s kickoff meeting to set norms and expectations that members of the project team have the option to look outside the team for possible solutions to complex problems.

    Some obvious points jump to mind:

  • Who pays for these advisors, and are their expenses in a budget for this purpose?


  • Who do these people work for and what roles does their supervisor play in providing their services to the team?


  • How is schedule to be maintained with a volunteer core of participants? What if they go off to do their day job?


  • Are these personal networks actually in touch with stakeholder or user or customer demands, expectations, and needs? In other words, if outsiders are to be drawn into the project as in the Agile paradigm, are these the right representatives?


  • Of course there are advantages as well. This staffing paradigm is really loose coupling of staff to the project; loose coupling is a good seed for innovation. If the company practices some form of free time, like the 20% free time at Google, then voluntary participation in an interesting project might be good use of the time.

    And, it's been my experience that many IT shops, perhaps most small IT shops, don't really track the effort that goes into projects; rather, they track the headcount assignments and major milestones. So, there's really not an issue around cost or cost tracking, and there may be some real help towards milestones.

    Bottom line: the MIT authors didn't give a hint about how this would work in the real world. But it could.

    Delicious
     Bookmark this on Delicious  
    Are you on LinkedIn?    Share this article with your network by clicking on the link.

    Friday, May 27, 2011

    What's in a cloud?

    More and more projects are using cloud resources, and so more and more project managers find themselves relying on this 3rd party as a participant in their project.

    But wait! What's a cloud?

    Fortunately, the US National Institute of Standards and Technology [NIST] felt compelled to write a nice concise definition of cloud computing, the gist of which, as reported on Fierce Government IT, is given below:

    On demand self-service that allows consumers to unilaterally provision computing capabilities without human interaction with the service provider,

    Broad network access, meaning that capabilities are available over a network and can be accessed by heterogeneous platforms, i.e., not just a dedicated thin client.

    Resource pooling such that different physical and virtual resources get dynamically assigned and reassigned according to consumer demand in a multi-tenant model.

    Rapid elasticity so that to the consumer, available capabilities often appear to be unlimited and can be purchased in any quantity at any time.
    Measured service allowing usage it be monitored, controlled and reported and automatically controlled and optimized

    In addition, NIST says cloud service models exist in three varieties:
    Cloud software as a service, in which applications run on a cloud but the user doesn't provision or modify the cloud service, or even application capabilities, apart from limited user-specific configuration settings.

    Cloud platform as a service, in which users can utilize cloud-provided programming tools to deploy applications without controlling most of the underlying infrastructure, with the possible exception of the application hosting environment configuration.

    Cloud infrastructure as a service might be termed the whole nine yards of cloud computing, except that NIST would never be so colloquial. Under it, the consumer has control over the operating systems, storage, deployed applications, and possibly limited control of select networking components (e.g., host firewalls) of the cloud environment available to the user via the network

    Finally, NIST also says there are four deployment models:
    A private cloud in which the cloud infrastructure is utilized by just one organization, though not necessarily operated by that one organization.

    A community cloud whereby several organizations with common concerns share a cloud.

    The public cloud provided by the private sector for all comers (which, although NIST doesn't say this, the government on occasion seems to believe consists entirely of Amazon Web Services).

    A hybrid cloud in which two or more cloud types are discrete but networked together such that a burst of activity beyond the capabilities of one cloud is shifted for processing to another.


    Image: NOAA.gov

    Delicious
     Bookmark this on Delicious  
    Are you on LinkedIn?    Share this article with your network by clicking on the link.

    Wednesday, May 25, 2011

    Online statistics for the curious

    In another posting I mentioned the Khan Academy as an excellent source of online learning in a video format with a really talented instructor, Sal Khan.

    Now, Khan occasionally uses a simulator in his statistics presentations to demonstrate things like "central tendency" and sampling distributions. Of course, it's all free and available to anyone. The simulations are part of an entire introductory level course in statistics for the practical minded at "online statistics book", an 'interactive multimedia course of instruction'.

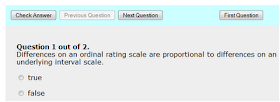
    I have tried the demonstration/simulation of the hazards of doing arithmetic on ordinal numbers. This demonstration is fully interactive and is very instructive of what we've preached here before many times.

    And, there are self tests included.

    Answer: False

    If've you got an interest in using some clever interactive tools to sharpen your understanding of some of the statistical concepts that project managers run into everyday, give onlinestastbook.com a look

    Delicious
     Bookmark this on Delicious  
    Are you on LinkedIn?    Share this article with your network by clicking on the link.

    Monday, May 23, 2011

    Rules I learned as coalition leader

    It's not easy recruiting a coalition, and then having it hang together in the tough times. To maintain context, I'm not talking about countries but rather companies. And I'm talking about doing a project via coalition management.

    If it sounds ugly, it sometimes can be. On the other hand, it's often the only way to scale up, and it's the only way to cement [or engage] disparate constituencies needed for project support, both politically and in the budget wars.

    Of course the industry name is 'teams', and supposedly the basic governance is laid down in a teaming agreement, subsequently written into a contract.

    By whatever name, it's a coalition.

    Rule #1: Companies don't have friends; they have interests.

    The impact of Rule #1 is that friendship on a personal level is all well and good, often required, but friendship ends at the logo's edge.

    Trust is more important than friendship because teaming agreements and contracts are only paper. The fact is: two companies can be teamed on project A and competing against each other on project B--at the same time. Their interests are served differently--simultaneously. Trust in the integrity of the relationships is what makes it possible.

    Rule 1.1: Some interests are private; their influences are felt even though things are otherwise private.

    Rule #2: The really big decisions are often opaque and laced with politics.

    They say that a completely rational person can not make a decision because paralysis of analysis will set in.  A dose of passion, strongly held beliefs, or sometimes even anger are necessary ingredients to catalyze the decision.  Usually, the meeting is pretty small where the decision comes down.  If you're in the room, great.  If you're in the room and at the table, even better!  If you're the 'decider', think also about those outside the room: their's to serve!

    Rule 2.1: Some decisions are deliberately deceptive to protect interests; other decisions may be unintentionally delusional, borne of unjustified optimism.

    Rule #3: Unified command is no panacea for conflict resolution. 

    General George C Marshall invented 'unified command' in 1942 as a means to govern the combined forces of the US and the UK.  In 1942, the idea was radical as a command structure between countries; it's objective was to obviate the separate but somewhat equal command structure of WW I. 

    As it did not do then, it does not do today in large scale project management: forestall disagreement.  What unified command does do is bring all the project managers of the team together under the leading team manager where the intersection of common interests can be managed for the common good.  Unified command forces the exposure of interests and the melding of heterogenous objectives, strategy, and practices--as appropriate.  [Can't forget that last little tag]

    Rule 3.1: Trust within the unified command will be in direct proportion to the honesty of the exposure of interests.

    Rule 3.2: You give up power to be in a unified structure; you give up power and identity to in a joint structure.  Joint structure are rare in business, less so in government.

    Rule #4: It's not agile, so patience and perservence

    Moving a coalition along is sometimes painstakingly slow.  Somehow, the weakest link--and slowest partner--is never your own company where you have some direct influence over performance.  Indeed, the weakest link is often that company who's interests are not vitally engaged.  "We care... but not that much". 

    There are, of necessity, many redundant elements.  That's good for all the reasons redundancy is good, but it's bad because it's the antithesis of simplicity.  Simple is that which possesses the least complexity for the task at hand.

    I've got more rules, but for another time.


    Delicious
     Bookmark this on Delicious  
    Are you on LinkedIn?    Share this article with your network by clicking on the link.

    Saturday, May 21, 2011

    Statistical limits--Quotation

    Nobody ever went into a fight over a set of statistics
    Justice Robert Jackson speaking to FDR

    Delicious
     Bookmark this on Delicious  

    Thursday, May 19, 2011

    Value ideas in system design

    There was a nice post in Eight2Late last month on how value ideas work themselves into system design. There's no news in the revelation that value is a pretty complex subject, far more than just a simple econometric dollarization.

    The basis of the blog is a paper published a few years ago entitled "Choosing Between Competing Design Ideals in Information Systems Development" by Heinz Klein and Rudy Hirschheim, and the argument framework developed by Stephen Toulmin. given as below:
    Claim: A statement that one party asks another to accept as true. An example would be my claim that I did not show up to work yesterday because I was not well.

    Data (Evidence): The basis on which one party expects to other to accept a claim as true. To back the claim made in the previous line, I might draw attention to my runny nose and hoarse voice.

    Warrant: The bridge between the data and the claim. Again, using the same example, a warrant would be that I look drawn today, so it is likely that I really was sick yesterday.

    Backing: Further evidence, if the warrant should prove insufficient. If my boss is unconvinced by my appearance he may insist on a doctor certificate.

    Qualifier: These are words that express a degree of certainty about the claim. For instance, to emphasise just how sick I was, I might tell my boss that I stayed in bed all day because I had high fever.

    Klein and Hirschheim took Toulmin's argument framework [above] and added a number of obstacles and barriers to rational discussion of values as applied to system design. These ranged over the political, factual, and emotional domains that often inform decisions. It's a good paper and the Eight2Late blog summarizes it nicely.

    But here's the real point: it's really hard for a hyper-rational person to make a decision when the facts are close.  Without some investment of passion, belief, and values, the paralysis of analysis keeps the hard core "just the facts.." kind of decider forever deciding.  To break the paralysis, someone with less dependency on rational analysis has to step in.  These are the folks who can be satisfied with being a supporter without necessarily being a believer.

    And the corollary: the passionate believer often fails to be sufficiently rational to see the other points of view.  Believers often ignore facts and are perfectly willing to be "fact free".  Believers are more committed than supporters.  Believers almost never abandon a position; they are what we call ideologues. Supporters, on the other hand, mix a bit of belief with some facts and are willing to provide support until the facts change.

    So, when you read Eight2Late's posting, take into account that a reasonable mix of all the sins of decision makers is really not a bad thing!


    Delicious
     Bookmark this on Delicious  
    Are you on LinkedIn?    Share this article with your network by clicking on the link.

    Tuesday, May 17, 2011

    About ordinals, brocolli, and squash

    A good friend of mine, a professor of computer science with and excellent grasp of statistics, wrote me this after reviewing a learned paper I had found on the web:


    All of [the author's] discussion of mean estimation assumes that you are analyzing survey results for which the responses are Low to High, or 1, 2, .. , n, e.g., a 5 point scale or a 7 point scale...not continuous scale.

    Everybody calculates means, standard deviation, t tests for this type of data...and everybody is wrong. These data are ordinal, which means the distance between the points is not defined.

    You can order them, but you can't legitimately do arithmetic with them. If you used very low, low, nominal, high, very high, how do you add 5 lows, 3 nominals and 6 very highs to get an average? But if you represent those values with 1,2,3,4,5, then you can do arithmetic, but without a distance measure the results are meaningless.

    As an example, in my case, when it comes to vegetables, green beans are a 3 (not bad, not good), brocolli is a 2 (don't really like it, but I eat it), yellow squash on the other hand is -100000 even though 1 is the lowest I'm allowed to go.

    The reason for this is that although the distance between n and n+1 is 1 for every point on the scale, the distance (in perception) between very low and low would probably be much greater than the distance between low and nominal. End of sermon.
    Dr. Walter P. Bond

    A similar, and supporting theme, is the backdrop for one of the more quantitative books on risk management for project managers, entitled: "Effective Risk Management: Some Keys to Success" by Edmund H. Conrow.

    If you have access to a university library, you'll probably find it on the shelf. As Glen Alleman says: a difficult read in some respects, but very insightful.

    Photo credit: 5 vegetables

    Delicious
     Bookmark this on Delicious  
    Are you on LinkedIn?    Share this article with your network by clicking on the link.

    Sunday, May 15, 2011

    Communicating with web portals

    I ran across a succinct article on 5 Tips for developing project web portals, and a link to recovery.gov, as an example of a useful portal used for disseminating program information to the public. There was also mention of several tools.

    Given the communication-centric job description of project managers, and given the age-old task of communicating to a broad audience of varied interests, skills, and loyalty to the project, the five tips on getting to a portal for a project are useful to review:
    1. Tackle the basics first and use layers. Putting a portal on top of bad document management or correspondence management will not resolve broken systems.
    2. Take an empirical, test-based approach to selecting software.
    3. Make lists. Create "a long-ish list" of possible solutions considering the following factors: open source versus proprietary, software as a service versus on premise and regional influence.
    4. Allow requirements to evolve.
    5. Don't be afraid to start over.


    Delicious
     Bookmark this on Delicious  
    Are you on LinkedIn?    Share this article with your network by clicking on the link.

    Friday, May 13, 2011

    Wiki and acquisition strategy

    And so now we learn that the US Coast Guard has put up a wiki to gather comments and suggestions in an effort to modify and improve their acquisition strategy for a new system.

    As reported last month, the USCG has these objectives for their wiki, a site that is open to the public:
    The Coast Guard Logistics Information Management System or CG-LIMS is a new logistics system to support ships, aircraft and shore facilities.

    In creating the wiki for CG-LIMS, the Coast Guard aims to gather best practices for taking a large project and breaking it down into smaller and faster deliverables.

    "We decided we needed to look beyond just what the program office, what the Coast Guard, could come up with and share the problem with industry," said Captain Dan Taylor, the project manager for CG-LIMS

    The phrase "... taking a large project and breaking it down into smaller and faster deliverables." certainly has the whiff of Agile.

    It certainly plays well with what Elizabeth McGrath, a senior DoD official tagged with performance improvement, said at a January 2011 AFCEA NOVA conference: "[the DoD will be] using iterative tactics to split projects into small partitions...", a position that aligns perfectly with the DoD's move to smaller, quicker IT projects as reported to Congress last November.  Presumably the Coast Guard, a unit of Homeland Security, will be in alignment with DoD.

    Of course, for as long as I can remember, industry has been invited into the pre-solicitation process to offer suggestions for improving the specifications, so that part of the Coast Guard's idea is not particularly new--just the wiki tool makes it unique.

    But, coupled with the tool is a sort of 'wisdom of the crowds' paradigm in which not only are the gov's acquisition managers looking for errors and omissions in the specifications, but they are, as they say, looking for ideas across a wide spectrum of issues--from anyone who cares to comment--to include everything from architecture to delivery to acquisition strategy.

    The wide open wiki is an interesting approach. Freelancers might be attracted to offer comments just to have a chance to put their nickel on the table and influence outcomes--a new phenom in my experience. Fortunately, few abuses have been reported. I'll be waiting to see if this collaboration approach takes hold generally in public acquisitions.

    Delicious
     Bookmark this on Delicious  
    Are you on LinkedIn?    Share this article with your network by clicking on the link.

    Wednesday, May 11, 2011

    Innovation by speed and agility

    An interesting article in the papers recently gave insight to the apps world and some of the critical success factors. In an experiment at Standford University, teams of three people were given relatively short timelines to come up with apps for Facebook.

    Not all the team members were geeks; some were business students. The idea was to find three people who could find harmony together and focus on the idea of a quick deliverable.

    One lesson that emerged: speed trumps perfection. Or, as we ordinary folks know it: best is the enemy of 'good enough'. Speed opens opportunity quickly for feedback, and high bandwidth feedback then allows for quick reaction and quick correction.

    Anyway, it's an interesting read with other insights for successful innovation.

    Delicious
     Bookmark this on Delicious  
    Are you on LinkedIn?    Share this article with your network by clicking on the link.

    Monday, May 9, 2011

    Reference Class Forecasting

    Bent Flyvbjerg has a long track record getting at the root causes of cost and schedule estimating errors in large scale projects, particularly those in the construction and transportation domains. His work is both theoretical and pragmatic, reflecting his former position as professor of planning in the Department of Development and Planning at Aalborg University [Denmark] and his current position as Research Director and professor of major program management at Oxford University [UK]

    One of his favorite targets is the Sydney Opera House, notoriously difficult to build, some 1400% over budget, but a priceless source of  civic pride; and considered by most to be an architectural masterpiece. [Business value vs project value?!]

    I ran across some of Bent's papers in a search I was doing on estimating.  One, "Design by Deception"  is a litany of major failures with some insights to their problems, mostly cases of looking the other way and choosing to believe the unbelievable. It's definitely worth a scan.

    However, my attention was drawn to a paper he wrote the the PMI Project Management Journal, somewhat strangely entitled "From Nobel Prize to Project Management: getting Risks Right"

    In spite of the title, the theme of the article is a practice named "Reference Class Forecasting".  From one view, RCF is just cost history applied to parametric model-based estimating, a method that's been around forever.   However, Bent and his co-authors spin it a little differently.  Their idea is given in 4 steps:

    Step 1: Form the 'reference class', a collection of similar-to projects for which there is both history and reasonable insight to the history so that adjustments for present time can be made.  [Bent never did say what the simliar-to projects might have been for the Opera House]

    Step 2: Develop a true distribution of the reference class, and from that distribution calculate the cummulative probability.  [Actually, they may have done it the other way around, but the main point is to come up with the cummulative probability].  They call the probability curve, developed from reference class, "the outside view".

    Step 3: Develop the "inside view".  The inside view is a traditional estimate by the project team.

    Step 4:  Adjust the inside view based on the probability of historical outcome from the outside view.  That is, develop a forecast using the reference class probability confidence curve.  In effect, according to policy or doctrine, or other direction, pick a confidence limit, and then adjust the inside view to have a corresponding confidence.

    Obviously, the objective of RCF is to improve the confidence in the final estimate.  Along the way there are a couple other objectives addressed.  One is to overcome "delusion" brought on by "optimism bias", a phenomenon studied by Tversky and Khaneman.  A general statement of such a bias is that indiviuals with optimistic outlooks tend to underestimate risks; the corollary holds: depressed individuals tend to overestimate risk effects.

    The other is overcome--or least provide the ammunition,--"deception" brought on by political neccesity.  Of course, in the latter case, legitimate accuracy is not actually politicially convenient.  Many times, the better data is 'buried'.  Shocking!

    The good news is that delusion and deception tend to be counter-acting.  When one is in accendance, the other tends to retreat.  Obviously, as an academic, Flyvbjerg has some appreciation of the politics of delusion, but he campaigns against it nevertheless.  On the other hand, delusion seems to be the easier target to shoot down.

    Delicious
     Bookmark this on Delicious  
    Are you on LinkedIn?    Share this article with your network by clicking on the link.

    Saturday, May 7, 2011

    Learning with Sal Khan

    From time to time I check in with Bill Gates.

     
    I find it's easiest to start with thegatesnotes.com, Bill's place where he lets folks know what's going on.

     
    One thing that's going on is education, and within education, Bill is endorsing the Khan Academy, led by Salman Khan.  It's a free academy covering mostly, but not exclusively, technical subjects ranging in complexity from about 1st grade to college.  You might want to follow the link to TED to hear Khan's description of what he thinks is going on.

     
    And, it's all free, in two forms:
    • 20,000+ videos of about 12min each, featuring Khan as an offstage instructor.  What you get on the video is the chalk board and the lecture. 
    • And, the second form is interactive exercises.

     
    Personally, I like the videos.  They're all on YouTube, but I like to work from the Academy because the course index is there and there is a semi-automatic bread crumb from one subject to the other.

     
    There's not a course on project management per se, but there is a lot there on finance, including risk, and statistics. In fact, he has content equal to about two semester's worth of statistics.  For the project manager, try out the one on expected value, and the one on the Normal Distribution.  You might find you'll like them and want to do more, or better yet: improve the skills of your project team!


    And, by the way, Bill also mentions from time to time Academic Earth, a site with full length college courses and also videos of college lectures.

     
    Everything I've looked at there is free also.  And, it's the creme de le creme of stuff.

     
    For risk managers on really complex projects, you might want to check out this course from Yale University on Game Theory


    Watch it on Academic Earth


    Delicious
     Bookmark this on Delicious  
    Are you on LinkedIn?    Share this article with your network by clicking on the link.

    Thursday, May 5, 2011

    The marriage of Monte Carlo and Earned Value

    In my risk management classes, I position EVM as a risk management tool because of its usefulness as a forecast tool. There're no facts about the future according to Dave Hulett, only estimates. And estimates are where the risks are.

    I also instruct Monte Carlo simulations [MCS] as a forecast tool.

    I get this question from students a lot: 'How do I integrate the forecast results from these two tools?', or 'How do I use both of these tools in my project; do I have to chose between them?'

    It's a reasonable question: EVM is a system of linear deterministic equations; Monte Carlo is a simulation of a stochastic process described by random variables in functional relationships. How should analysts span the deterministic and the stochastic, and the process model and the linear equation model?

    The answer lies in the fact that both systems, EVM and MCS, can be used to predict the EAC--estimate at complete. And, EVM practices do allow for re-estimation of remaining work as an alternate approach to the linear equation forecast. Running a simulation is one way to do the re-estimation.

    Reconciliation of the calculated EAC from the EVM and the simulation EAC from the MCS means reverse engineering the required efficiencies for utilization of cost and schedule going forward.

    The equation at work is this one:
    EAC = AC + [BAC - EV] / CPI

    The facts are AC (actual cost), BAC (budget at completion), and cumulative EV. The cumulative CPI is a historical fact, but it's only an estimate of future performance. That's where the MCS comes in. MCS results may shape our idea about this estimate when compared to the EVM linear equation calculations.

    Of course the MCS results are not a single point number that fits conveniently into a linear equation; the results are a distribution of possibilities. How to deal with this?

    There are two approaches:
    First, the expected value of the MCS distribution could be used as a good estimate of the EAC. Expected value is deterministic, so it can be used in a linear equation with other deterministic values

    Second, the MCS usually provides a cumulative probability curve, the so-called "S Curve", from which a single point number can be picked according to a project policy or doctrine about how to pick.

    Here's how the second approach might look. The project policy about risk aversion--that translates into picking a point on the confidence curve--is usually documented in the risk management plan.  Using the policy guidance, an EAC is picked from the MCS confidence, and then compared to the EAC calculated by EVM equations.


    Once the MCS value is determined, the equation above is reworked to solve for the future CPI. Now you have two CPI's: one from the EVM estimate, and one from the MCS re-engineering. What to do now?

    The conservative thing is to pick the worst case. The management thing is to determine what needs to be done or changed to bring the CPI into an acceptable range, and then do it.


    Delicious
     Bookmark this on Delicious  
    Are you on LinkedIn?    Share this article with your network by clicking on the link.

    Tuesday, May 3, 2011

    Confidence interval in 7 deadly sins

    Mike Cohn, the guru at Mountain Goat Software, recently gave a webinar presentation to a bunch of PMI folks entitled "Agile and the Seven Deadly Sins of Project Management" [just click on the link for a free copy of the charts from Mountain Goat]

    Overall, an informing presentation

    In an explanation of how agile fights information opaqueness, Mike presented a slide with a bar chart of team velocities and announced a 'confidence interval' as the main take away.

    Gasp!.... I was shocked! shocked! to hear statistics in an agile discussion; sounds so much like management--project management at that.  But, it's easy to tell that Mike is pragmatic, and confidence intervals are nothing if not practical. 

    Fair enough .... but actually there was no explanation given as to what entails a confidence interval.  I'll correct that failing here.

    First, an interval of what?  Would you believe the possible value of a random variable?  And which would that be?  Answer: the sample average of velocity, call it V-bar.  And V-bar being a random variable, it has a distribution that prescribes how likely is any particular value of V-bar to fall into the interval of interest, ie, the confidence interval. 

    Second, we don't actually know the distribution of V-bar and we don't know the distribution of the population V (velocities), so we can't know what the next V is going to be, or its likelihood.  But, we know (from V-bar) an estimate of the population (V) mean.  Thus, we can use V-bar as an estimating parameter of velocity, even though V-bar does not predict the next velocity value. (Example: average team throughput = V-bar x input units, like story points or ideal days)

    Third, since we don't know, and it's not economic to find out what the distribution of V-bar really is, it's customary to model it with a distribution that has been tried and proven for this purpose--the T distribution.

    The T-distribution is somewhat like a bell shaped distribution, except T usually has fat tails for small values of the parameter N-1 where N is the count of the values in the sample. 

    So what are the chances for V-bar, and how do you figure that out from the data given in Mike's chart?

    I've reproduced my version of Mike's chart below; there are 9 velocity metrics ranging from about 37 to 25:


    To calculate the quality of the confidence interval, some iteration is required.  It's typical to first pick a level of confidence, say 95%, and then by use of a formula, and a set of 't' tables from the T distribution, calculate the corresponding interval.  If the results are not satisfying, a new pick of parameters may be required.

    Here are the steps:
    • Calculate the sample average V-bar, in this case 33, and the sample standard deviation, 4.1.  Formulas in Excel will give you these figures from the 9 velocity points in the chart above.
    • Look up the 't' value in a T-distribution table for N-1.  N in this case is 9. 
    • Pick out the 't' value for 95% confidence [in t tables, it customary to look up a parameter labeled alpha; for 95% confidence, alpha = 0.05], in this case: 2.36 [there are formulas in Excel for this also]
    You'll get something like this:


    • Calculate the interval around the center point of V-bar:
    +/- t * sample standard deviation / sqrt(N)
    +/- 2.31 * 4.1 / sqrt(9)
      +/- 3.2

    With just a little inspection of the formula above, and the t-tables, you'll discover that the interval gets wider as alpha is picked to be smaller [higher confidence].  In the limit, to have 100% confidence in the interval, the interval would have to very wide to cover every possible case conceivable.

    Values in the velocity chart outside the interval are outside the quality limits of 95% confidence.

    For reference, here's the model of V-bar, specifically the T distribution with N-1 = 8:


    Need more?  Check out these two references:

    And, check this out at the Khan Academy:


    Delicious
     Bookmark this on Delicious  
    Are you on LinkedIn?    Share this article with your network by clicking on the link.

    Sunday, May 1, 2011

    Simplicity v Complexity

    Heard recently:

    Simplicity requires a lot of complexity
    Jack Dorsey
    Founder, Square, Inc
    Can you repeat that?

    Making it simple for the user/customer/beneficiary often requires a lot of 'backstage' complexity.  Ask any system engineer.  Indeed, ask those that manage the 'experience' at Disney World!

    Project managers beware!  Often, the sponsor's vision is simplicity itself.  And, the sponsor makes resource commitments on their idea of value.  But the sponsor's value allocation of resources may not comport with the resource allocation needed to make project outputs simple for the user/customer/beneficiary.

    Why should it?  PM's can't assume the sponsor has any real idea of how to make the vision a reality.  That's for the project team to discern.

    Inevitably, there's going to be a gap: a gap between a value allocation on the one hand and a implementation estimate on the other hand.  What bridges the gap?  RISK!  And of course, it's left to the project manager to the be chief risk manager.

    Don't expect much help from the sponsor to close the gap.  Just the opposite: expect demands that you close the gap!

    I've expounded on this idea before.  I call it the 'project balance sheet': a way to represent the three variables that inform every project charter: sponsor value expectation, project implementation need, and the risk between them.

    The tension of simplicity and complexity is ultimately a tension between value and resources.  Beware simplicity!


    Delicious
     Bookmark this on Delicious  
    Are you on LinkedIn?    Share this article with your network by clicking on the link.